How To Integrate Plausible Analytics With Webflow (Including Custom Goals And Events)

I recently set up Plausible Analytics - a privacy-focused, lightweight and open-source analytics tool - for one of our clients on Webflow, and I wanted to create a guide to make it easier for others who want to do the same as I ran into a few "gotchas" that I had to unpick with their technical team before data started trickling through.
Initial Setup
In order to use Plausible, you'll have to sign up for an account on their site and get your installation script. Head to your Site Settings > Custom Code and paste that into the <head> section. After you've saved it and republished your Webflow site, you should be able to verify the installation on Plausible's side.
Additionally, you'll need to check which measurement options you want for your site. I left off hashed page paths and e-commerce revenue as the client didn't need them, but it's all down to your specific use case.

Setting Up Custom Goals
Plausible have a few guides on how to set up custom goals (here and here), but I found you need a slightly tweaked workflow for integration with Webflow.
Capturing Page View Events
To understand page view events - which is handy when tracking form submissions as you can redirect users to a 'thank you' page after submitting a form - head to the dashboard.
Click on your site from the dropdown, then select 'Site Settings'.
You'll see a list of options on the left. Select 'Goals', and then 'Add Goal'.
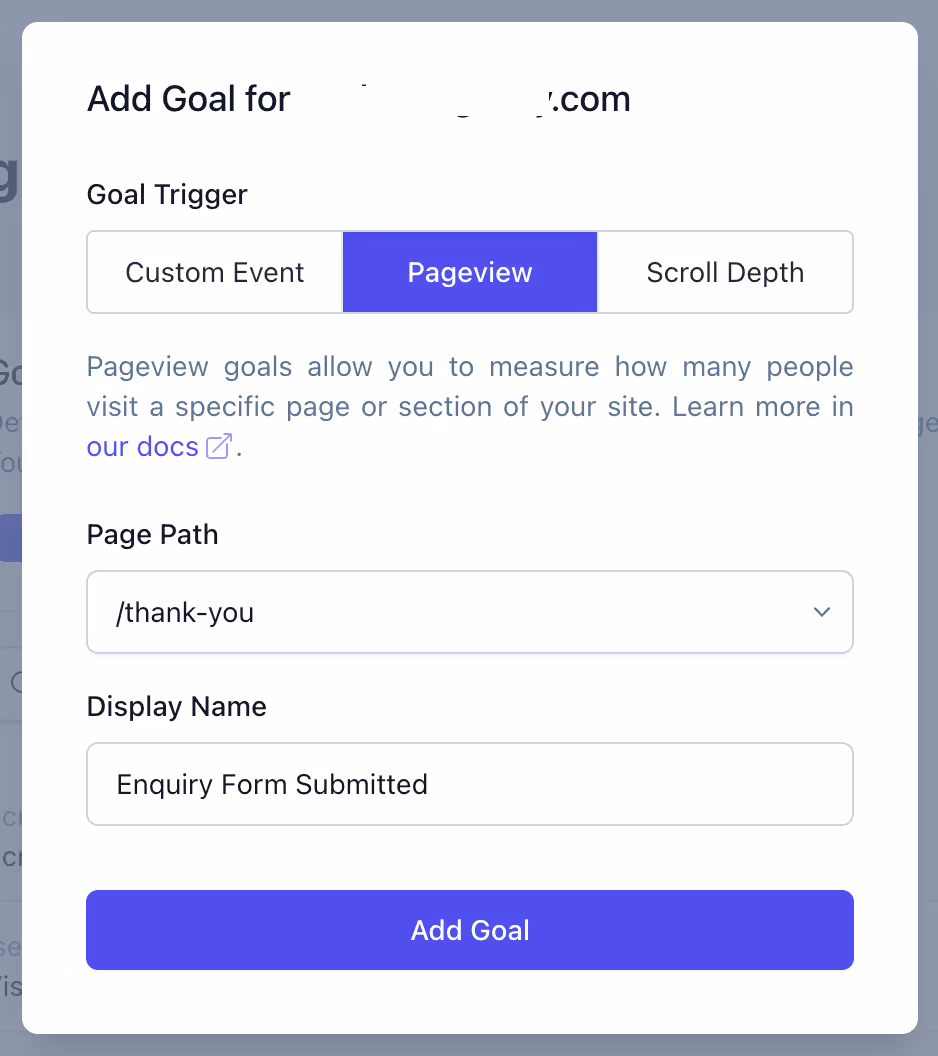
After selecting 'Pageview', you can enter the relative page path you want to track (e.g. '/thank-you') and then set a display name for your goal (e.g. 'Enquiry Form Submitted').
Once you add the goal, any times the page is viewed, this event will track on your dashboard.
As a bonus, Plausible also shows data for any events that have been triggered since the script was added to your site. So if 17 people have hit your 'thank you' page, it will show that data even though it was collected before the goal was set up.
Capturing Custom Click Events
Capturing custom click events for Plausible Analytics in Webflow can be a little tricky until you've figured out how it all works (which is why I wrote this).
Plausible currently tracks clicks via CSS classes added to elements (e.g. 'plausible-event-name=Form+Submit'). However, in Webflow, the equals (=) and plus (+) symbols can't be CSS class names, and will be converted to dashes (-) when published.
Plausible recommends using the format 'plausible-event-name--signup' for Webflow specifically, and this is what I've found works best.
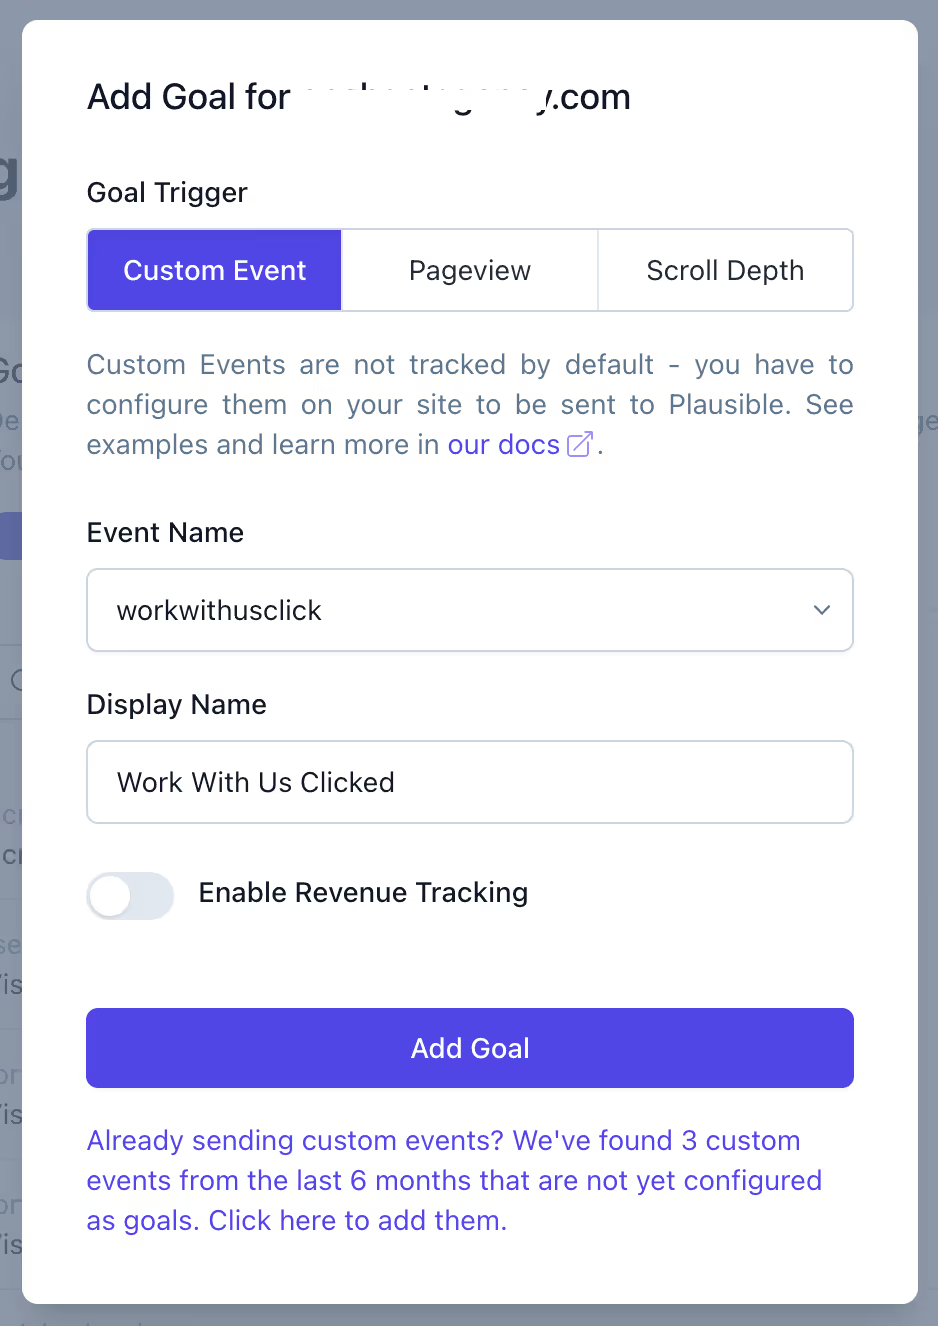
For example, on a client's site we have a button that is for working with them. So, we added the class 'plausible-event-name--workwithusclick' to the button, and then created a custom event in Plausible with the event name 'workwithusclick' and the display name of 'Work With Us Clicked'.
Once you add that goal, it will start appearing in your dashboard. You can test it by clicking the button you tagged on your republished Webflow site.
Capturing Scroll Depth Events
If you're interested in tracking how far users are scrolling on your site, you can set up a custom goal for scroll depth.
This doesn't require any additional work on Webflow's side and can be entirely managed inside of Plausible.
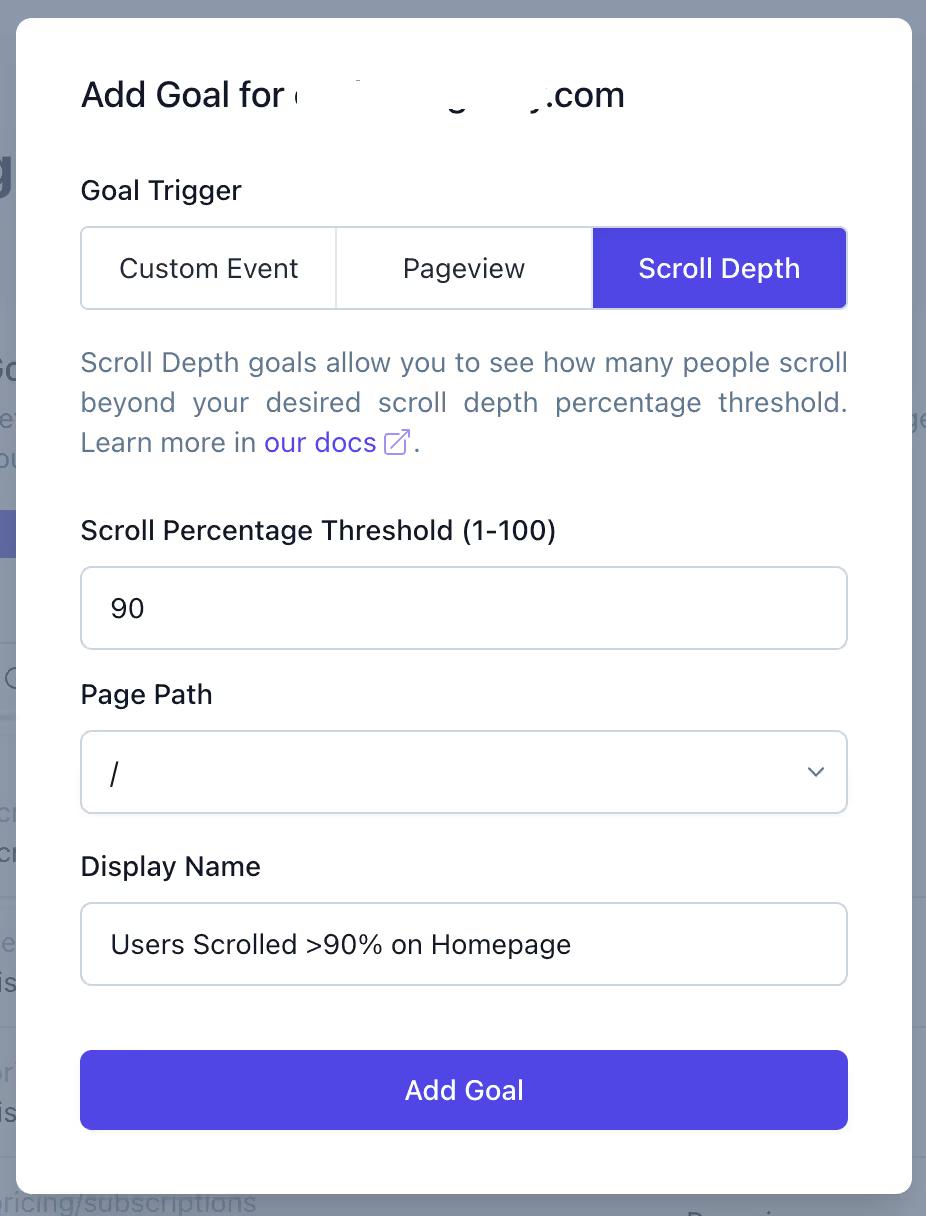
Simply set the threshold for the scroll (e.g. 90%), enter the page path (e.g. / will be your homepage) and the display name (e.g. 'Users Scrolled >90% on Homepage), and add the goal.
Like other events, if there's already some data captured since the script was added to your site, that will be visible on your dashboard immediately.
This is useful for seeing how engaged people landing on your homepage are, and if they're seeing key information like testimonials, features or forms.
Not Seeing Your Latest Goals?
When I was initially setting Plausible up, I thought that the data was not pulling through for custom events as it was not showing in the dashboard even when I visited a tracked page or clicked a tracked button.
However, after chatting with their support team I discovered that any data from today is only shown when filtering by 'Today' in the analytics dashboard as the data is constantly updating and can skew other data.
Once you jump into that view, you'll see all the goals and data you just set up, and as the days go on that data will be shown in other views like the last 7 days etc.
Hope that helps, and enjoy reviewing your data. If you'd like help with your integrating other tools with your Webflow site, book a call with us to see how we can help.