How to speed up a slow Webflow site
Without proper optimisation, sites can get sluggish on mobile. Not just Webflow sites, but any site.
Pages load fine, content appears, and then for several seconds nothing responds, taps don't register, scroll feels stuck, and the page only becomes usable once whatever's running in the background finally finishes.
This guide walks through the most common causes of a slow site and how to fix them. We'll start with a lesser-known cause of post-load freezing, then move through the wider performance checklist.
Start with a real measurement in DevTools
Before changing anything, record a Performance trace in Chrome DevTools on a real mobile device or with mobile emulation. Open DevTools, go to the Performance tab, click record, reload the page, and stop the recording after ten seconds. Save the trace.
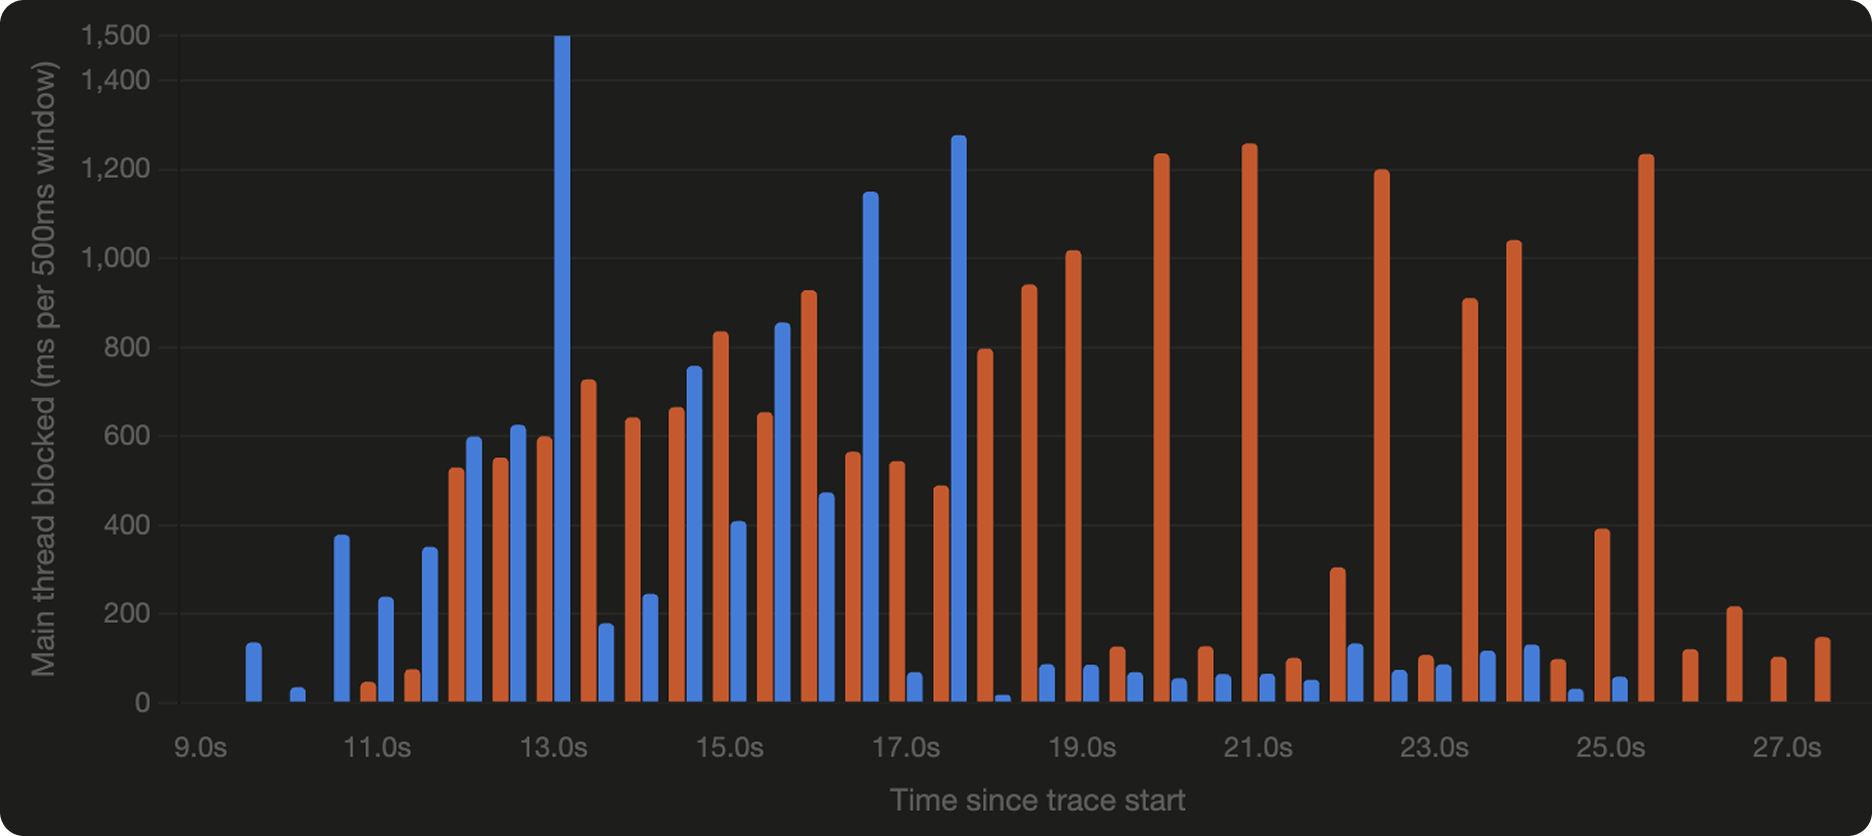
The Performance panel will show you a flame chart of every task that ran on the main thread. The bars at the top are individual tasks. Anything wider than 50ms is considered a long task. Long enough that the browser can't respond to scroll or tap input while it runs. If you see a wall of red-bordered bars in the seconds after page load, that's your jank.
Looking at a real trace tells you what's actually slow rather than what you assume is slow. The fix is often not where you'd expect.
1. Check Webflow's bot blocking setting first
This can be a big performance killer in Webflow, and it's not super obvious.
Webflow uses Cloudflare Turnstile under the hood to provide bot blocking on form submissions. When the setting is enabled, every form on every page of your site renders an invisible Turnstile challenge as soon as the page loads. Each challenge runs browser fingerprinting, posts results back via postMessage, and contributes a substantial chunk of main-thread blocking work, even when no user has touched the form.
This can become a big issue on pages with multiple forms. We recently audited a client site where one page contained seven forms, a pre-order capture, four city-specific signup forms, a demo request, and a newsletter. Recording a Chrome trace on that page showed:
- Around 3.1 MB downloaded for Turnstile alone (seven iframes plus seven challenge responses)
- Roughly 7,000ms of total Turnstile JavaScript evaluation time
- The longest single blocking task was 1,259ms, meaning the page was completely frozen for over a second straight
- The main thread was blocked for 66% of the first 30 seconds after load
On a second page with two forms, the same pattern caused the main thread to be blocked 39% of the time, with one stretch where the page froze for over 1.5 seconds.
Disabling bot blocking solved both problems entirely with a single click. The entire site felt instantly smoother and more usable on mobile afterwards.
How to disable it
Open Site settings > Apps & Integrations > Cloudflare Turnstile spam protection. There are typically two switches: spam filtering and bot blocking. Disable bot blocking if you're noticing this performance issue. Spam filtering is server-side and has no client-side performance cost, so you can and probably should leave that on.
What you lose, and what to do instead
Bot blocking does catch sophisticated bot traffic that the server-side spam filter misses. If you're getting hammered with form spam after disabling it, you have a few options:
- Add hidden honeypot fields to your forms with custom code. There's close to zero performance cost, and catches the dumb bots which are the majority
- Re-enable bot blocking on a per-form basis using a manual Turnstile embed only on the high-value forms (e.g. report downloads, demo requests), rather than every form on the site
- Watch your form submissions for a week or two with bot blocking off and only re-enable if spam volume genuinely warrants it
For most sites, server-side spam filtering plus a honeypot is more than enough.
2. Defer your third-party scripts
Tools like GSAP, jQuery plugins, Hotjar, and other analytics libraries are often loaded synchronously, which means the browser must download, parse, and execute them before continuing to render the page. On mobile, JavaScript parsing is two to five times slower than on desktop, so the cost stacks up quickly.
For most third-party scripts, adding the defer attribute to the <script> tag is safe and dramatically reduces blocking time:
<script defer src="https://cdnjs.cloudflare.com/ajax/libs/gsap/3.12.5/gsap.min.js"></script>
If a script initialises immediately when it loads, wrap your initialisation code in a DOMContentLoaded listener so it still runs after the deferred script has loaded.
For analytics tools like Hotjar, you can go further and delay them by several seconds using a setTimeout wrapper in your site footer code. The data is recorded slightly later, but the page becomes interactive much sooner.
3. Remove scripts from pages that don't use them
Webflow loads site-wide custom code on every page. If you're loading GSAP plugins like SplitText, Draggable, or InertiaPlugin in your global footer code, but only one page uses them, every other page on the site is downloading and parsing dead weight.
Move page-specific scripts into the page-level custom code panel instead, so they only load where they're actually needed. This is especially worth checking on content pages: articles, guides, and CMS templates rarely need the full animation toolkit that a homepage might.
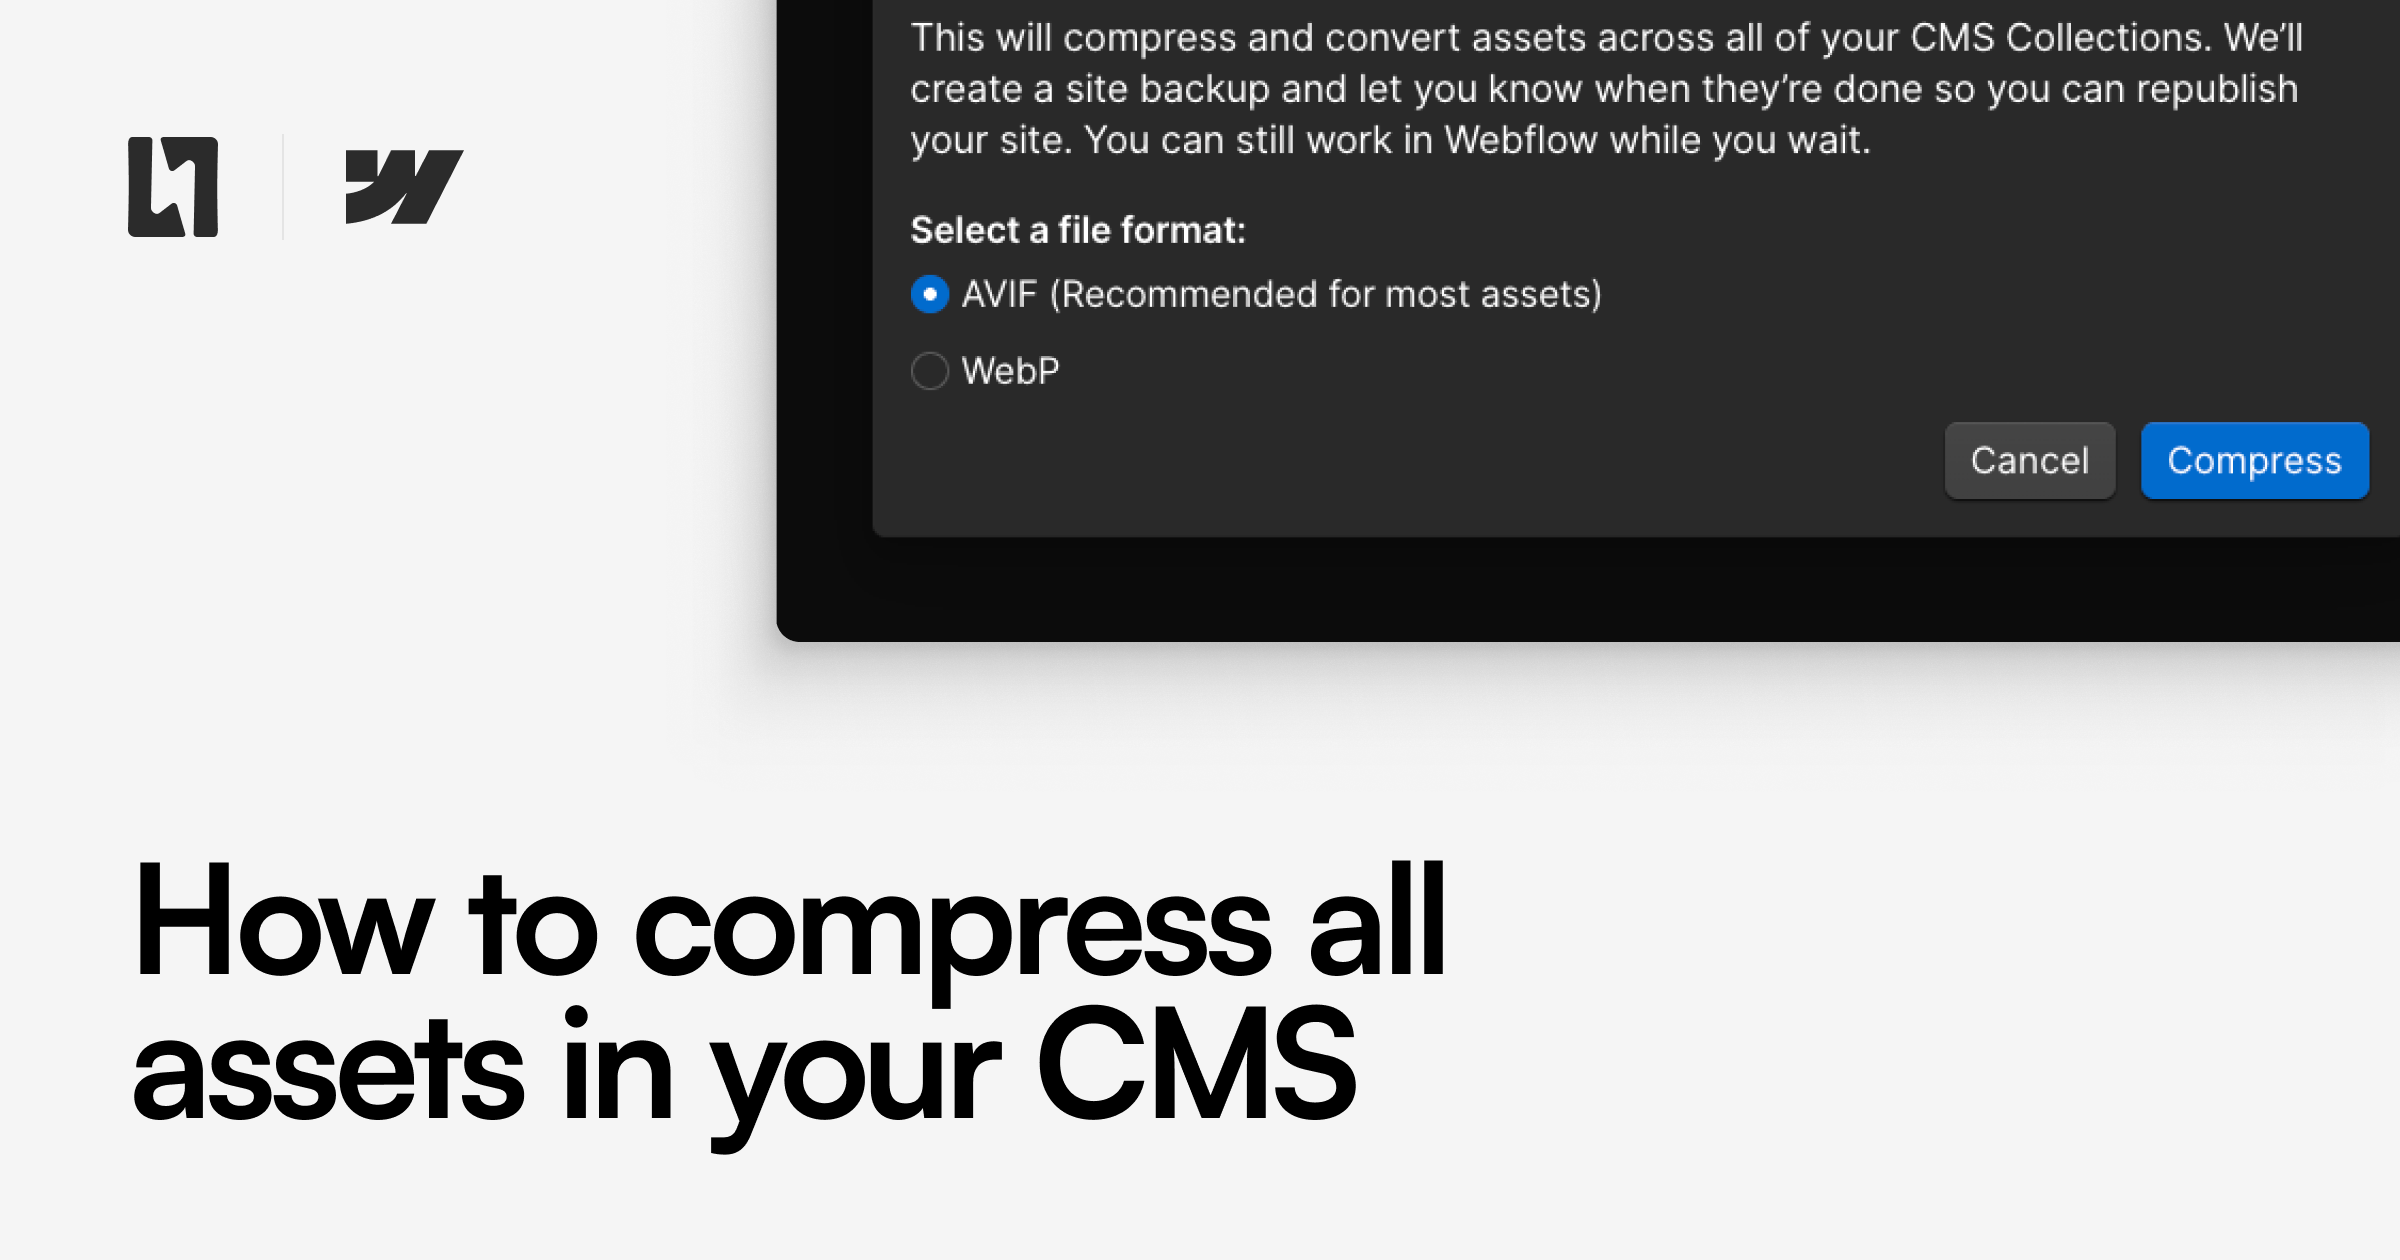
4. Compress your CMS images
Webflow has a built-in tool that compresses every image in your CMS to WebP or AVIF in a few clicks. AVIF tends to produce 20-50% smaller files than WebP with better visual quality, so it's our recommended format.
To run it, open the CMS, click the small options button next to the CMS title, and choose Compress Assets. Webflow handles the rest. We've covered this in more detail in our guide on compressing CMS assets.
5. Convert TTF fonts to WOFF2
If your site loads custom fonts as .ttf files, you're shipping uncompressed font data. WOFF2 is the modern web font format and produces files 30-50% smaller.
You can convert TTF to WOFF2 using a tool like fonttools locally, then re-upload to Webflow's asset manager and update your @font-face declarations in custom code.
If your site uses Google Fonts, you should also consider hosting the fonts locally for a performance boost.
6. Use proper video formats with the right attributes
If you're embedding video using a <video> tag, make sure the file is encoded as H.264 MP4, not QuickTime MOV. MOV files often play back inconsistently across browsers, and on iOS Safari they can force fullscreen playback unless you add the playsinline attribute.
A safe baseline for inline video embeds:
<video autoplay loop muted playsinline poster="poster.jpg">
  <source src="video.mp4" type="video/mp4">
</video>
The poster attribute is particularly useful, it shows an image immediately while the video loads, so the user sees content right away rather than a blank space.
7. Lazy-load anything below the fold
Images, videos, and iframes that aren't visible when the page first loads should be marked loading="lazy". Webflow does this automatically for CMS images in many places, but it's worth checking your custom embeds and Rich Text content.
For embedded YouTube or Vimeo videos in Rich Text fields, consider replacing the standard embed with a click-to-play poster image or by popping the embed in a lightbox. The full embed only loads when the user clicks play, saving hundreds of kilobytes of player JavaScript on initial load.
8. Re-test and compare
After making changes, record a fresh Performance trace and compare against your original. The metrics that matter most are:
- Total Blocking Time: sum of long task durations beyond the first 50ms. Lower is better.
- Largest Contentful Paint: when the biggest visible element finishes rendering. Should be under 2.5 seconds.
- Time to Interactive: when the page can reliably respond to user input. This is what "feels fast" really means.
If you've disabled bot blocking and deferred your scripts, you should see Total Blocking Time drop substantially, often by 80% or more on form-heavy pages.
When to ask for help
If your site still feels sluggish after working through this list, or if you'd like someone to record and analyse a performance trace properly, get in touch with us at hello@lightningux.design.
Performance work pays compounding returns. Every second shaved off your load time is a measurable improvement in conversion, SEO, and user satisfaction.